The valuation comparison between most equity markets and market-cap weighted US equities might appear favourable due to the concentrated rally in 2023 driven by optimism around productivity gains from AI, and a robust US consumer base contributing approximately 70% to US GDP.
Areas of the market which have been highlighted in abundance are emerging markets, “value” or cyclical sectors and probably the most popular, small caps. Drawing lessons from history however, valuations alone are never enough to justify a tilt towards a particular sector, as generally there is an explanation as to why these areas may be trading cheaply (Assuming some level of the efficient markets hypothesis holds true, which is that public information is incorporated into asset prices).
What we’ve seen towards the end of 2023 is an improving economic picture in the US, which is more supportive of a soft-landing rather than a recession in the latter half of 2023 into 2024.
Despite this resilience, there are several factors for us to consider broadly:
- Economic uncertainty remains higher than average.
- Geopolitical tensions have notably increased following the Red Sea attacks and Hamas conflict.
- Real rates will be higher on average than in the past decade.

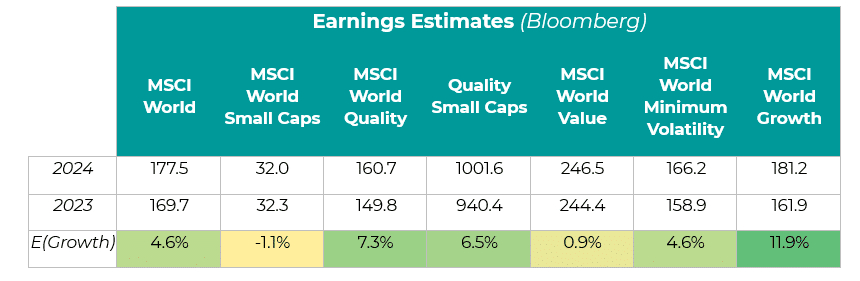
Source: Innova Asset Management, Bloomberg
As seen above, the valuation spread of a composite of P/B, P/E, CAPE, P/S and P/CF between US small caps and US large caps has reached 2 standard deviations below its long-term average. This is quite a significant gap, which is primarily due to the sheer magnitude of the rally in the Magnificent 7.
Macroeconomic Sensitivity
This valuation spread is also highly related to the tightness of financial conditions, posting a negative correlation to real rates. This essentially means that small caps get cheaper when financial conditions are tight, though when cutting cycles begin, we begin to see multiple expansions in small caps, which is an environment that is anticipated and likely, coming into an US election year where inflation is subsiding. The risk to this is the strength of US GDP growth, a resilient US labour market, and slight upticks in wages growth signals – which may cause the Fed to be a little more cautious around the timing of the cuts.

Source: Innova Asset Management, Bloomberg
Real rates hit 15-year highs in late 2023, marking a signal of tightness in financial conditions. The Fed would likely not want this tightness to continue to reverberate through the system, especially if inflation has been deemed controlled, and the liquidity injected into economies is coming to an end. The whole idea of a “soft landing” is that the Fed is able to cut rates into a system with low inflation uncertainty and normalize borrowing costs to recomfort the consumer and corporates who may have to refinance. Rate cuts have had typical impacts on rate-sensitive areas such as housing, credit, manufacturing, and consumer loans. Given this, why would they let that pain flow into less immediate sensitive areas if they can cut rates which sit at 5.25% when PCE has just hit a 6-month annualized rate of 1.86% (as of December 2023)?
Whilst we’re starting to see some signs of weakness in company fundamentals in the Q4 2023 reports, the potential tremors that higher rates could’ve brought haven’t been truly felt in labour market data, consumption patterns and asset prices.

Source: Innova Asset Management, Bloomberg
We also see the clear relationship between valuation spreads and the strength of the manufacturing sector in the US, which has already entered recession as of 2023. Given our base case for the US economy is no longer a full-blown recession, the manufacturing sector should not capitulate to levels seen in the previous recession on the chart (see GFC 2008 and Tech Wreck 2000), where we saw levels of 35-40. An improving manufacturing sector should further support the spread compression and an outperformance of small caps over large caps.
However, we mentioned earlier in this article that valuations cannot be the only component to rely on — so, what are some other considerations?
Interest Coverage

Source: Innova Asset Management, Bloomberg
Above we see how the spread of the Interest Coverage Ratio (EBIT / Interest Expense) between small companies and large companies has changed in the US. The long-term average suggests that generally small caps should have an Interest Coverage of ~0.65 less than large caps. We currently see a level closer to -2.00, which suggests small caps are slightly more vulnerable on their balance sheets compared historically against the large companies. This may warrant a slightly more active-based approach for assessing small-caps, while trying to avoid those who are at risk of refinancing and struggling to cover their debt obligations.
How to take that small-caps exposure
We are of the view that there is still uncertainty among major global economies, and in 2023 there was a clear divergence in winners and losers. Given this, it might be too risky to take on areas of the markets which are too economically sensitive (cyclical) in case there is an escalation of geopolitical tensions or default cycle risks which have not yet materialized. Below we can see the sensitivities of equity sectors to Real GDP, in quarterly explanatory regressions with a control on market beta:
| Real GDP Beta | Real GDP T-Stat | |
| Small Cap | 0.98 | 2.38 |
| Value | 0.83 | 2.65 |
| Quality Smalls | 0.70 | 1.72 |
| Quality | -0.80 | -3.24 |
Note: We use the sum of the past 4 quarters log-returns of each equity factor and broader equity market, to try and see whether fluctuations in real GDP has an effect on the past 1Y variations in style-factors has net of the market. The period is from 2000-2023.
One must be cautious of the risks associated with any shocks to economic conditions when taking exposure to small caps, as they can cause heavier drawdowns and for areas such as small caps we tend to see them be ‘thrown out’ first by investors. However, if we filter the small-cap universe with a quality screen, the opportunity set looks far more robust to economic downturns and has offered much better protection historically than comparable equity styles:

Source: Innova Asset Management, Bloomberg
The way we define this “quality-screened” small-cap index is following the MSCI Small Cap Quality Index, which filters the universe by 3 main variables:
- High Return on Equity (ROE)
- Stable YoY Earnings Growth
- Low Financial Leverage
The combination of these metrics removes small companies with less robust balance sheets, are highly indebted and display volatility in their earnings. These companies typically get quite hurt during rate hiking cycles and when real rates are at levels higher than average. Whilst these more economically sensitive companies can have strong rebounds in recovery phases of economic cycles, we can see in the drawdown chart that quality small caps have kept up (or surpassed) small caps in the recovery during previous crises, whilst also providing more protection on downsides.
Earnings
International small caps are expected to have a slight decrease in this year’s earnings compared to 2023 – whereas quality small caps globally are expected to grow at 6.5%.
Valuation compared to its own history

Source: Innova Asset Management, Bloomberg
The chart above highlights a valuation composite of Price to Book, Price to Earnings and Price to Cash Flow compared to history for Global Quality Small Caps. We can see that it is trading at levels clearly below the historical average.
Country and Sector Composition – MSCI World ex Australia Small Cap Quality 150 Index

So, this quality filtered small-cap index seems like quite an intuitive allocation, if we anticipate:
- An uncertain economic outlook where companies with robust balance sheets outperform.
- No severe capitulation (as this is where you’d want to own the junk in small caps on the rebound)
- A leg down in real yields given core PCE has settled below 2% and the risk of tight financial conditions now becomes a focal point for the Fed.
- A continuation in US dominance over other equity markets (given the 75% weighting).
- The productivity from AI speculation to continue, as our findings suggest that Quality Small Caps has a significant loading on “AI” stocks as proxied by the Indxx Global Robotics & Artificial Intelligence Thematic Index
- A bounce back in manufacturing, which has been impacted by rising real rates.
Now may be the time to consider quality small companies in one’s portfolio given the attractive risk/reward payoff profile under multiple different scenarios.


