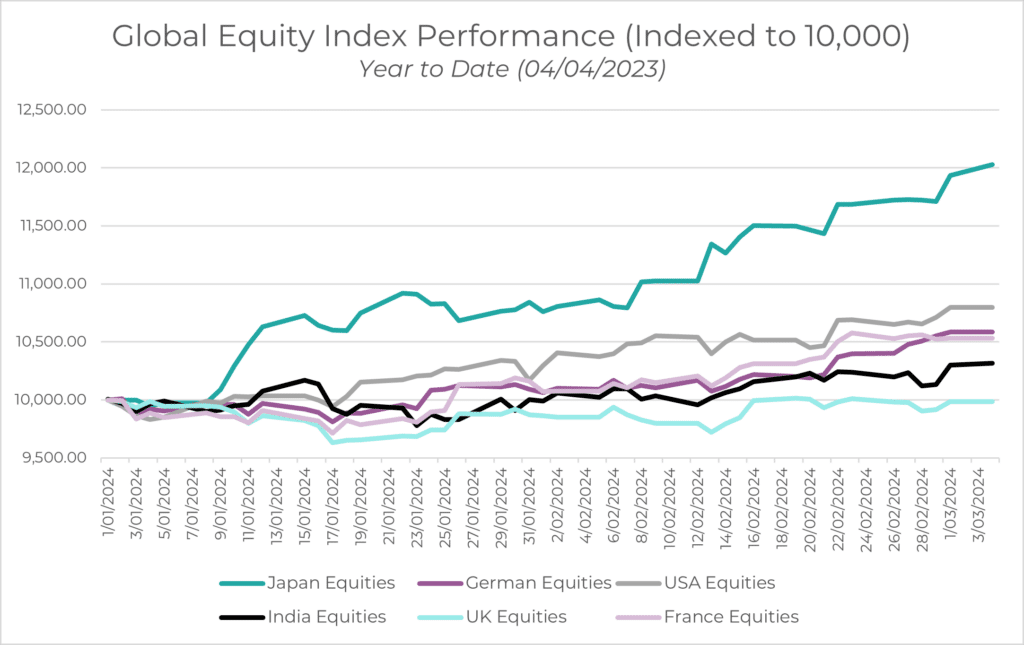
Japan and the UK are in technical recession. Germany and France are about to be. China is going through a spiralling deflation cycle. But hold on, the United States of America is booming, as is India! So, five of the seven largest countries by GDP have economic issues, and all these countries are interlinked via trade and supply chains. However, look at the stock markets of all these countries this year:
Source: Innova Asset Management, Bloomberg
Clearly, markets and economies are not the same thing, but heavily related. This article will demonstrate that commentators, investors, and portfolio managers can paint whatever picture they’d like using the current macroeconomic and market data given its highly bifurcated nature currently. There are so many contradicting narratives out there, with bulls calling out bears for not adapting to these “new times” because “this time is different”, and bears calling bulls out for overpaying for assets driven by an AI “bubble”.
I will focus primarily on the US economy, as it serves as the bedrock for global economies, holding the reserve currency and possessing the largest companies in the world. I will begin with a “positive” picture and move onto a “negative” picture – outlining whether particular signals are “forward-looking” or “backward-looking” throughout. Keep an eye out for examples where the same indicator is used, but shown in a slightly different way to tell a completely different story.
It is however important to understand the fragilities that underlie the other surrounding economies too, as weakness from key trade partners and creditors may play a significant role in the US’s condition, as well.
Positive Picture
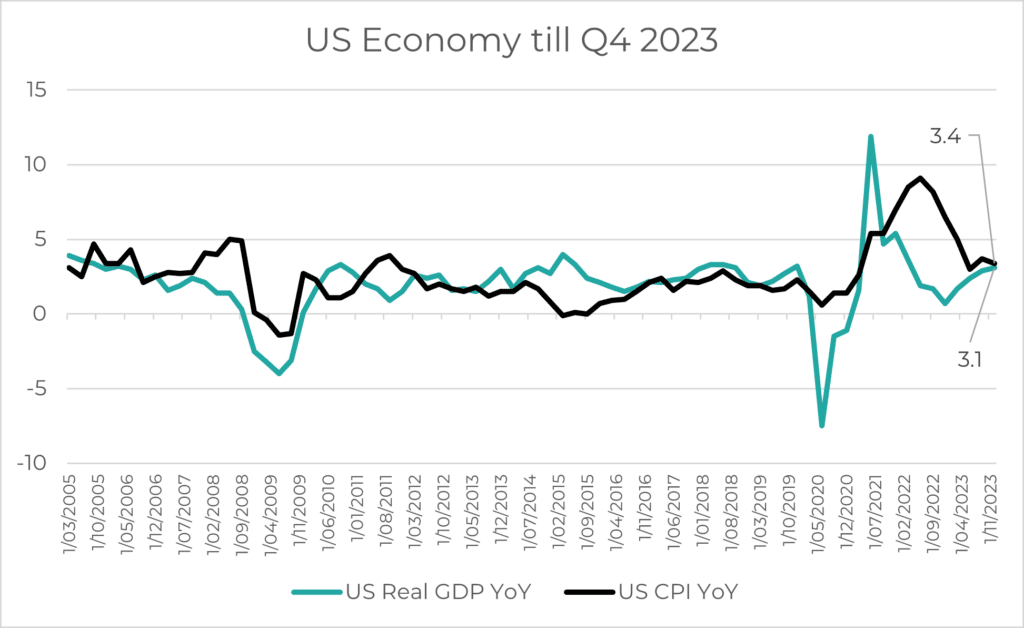
The key drivers underlying positive sentiment is the strength of realized growth, unemployment, and cooling inflation.
Source: Innova Asset Management, Bloomberg
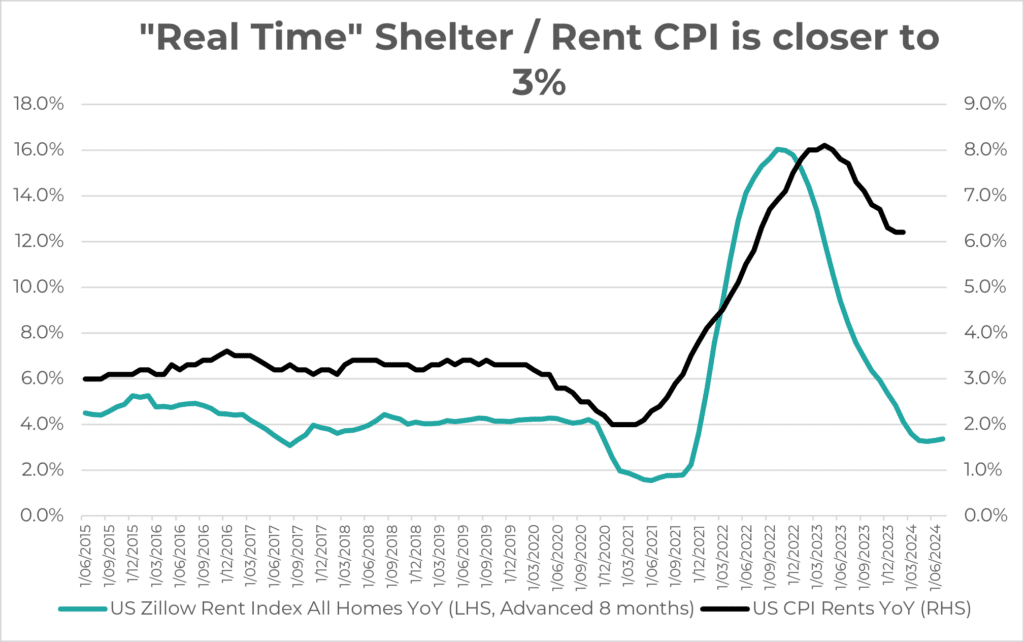
US Real GDP and US CPI figures are backward-looking, tracking the progress in economic growth and changes in prices over a 1-year period. We see strength in growth, and a cooling in inflation towards the 2% target. We have highlighted many times that shelter inflation often lags due to the way it’s measured, but if considering more “real-time” data, we are very close to target 2% – this is bullish (if growth is also robust, which it is).
Source: Innova Asset Management, Bloomberg
Following on from the cooling of inflation story, shelter is somewhat misrepresented within the official CPI prints, following a methodology that takes into account rents from 1Y ago ‘till today, whereas the Zillow rent index is a more “live”, and hence a forward indication of the change in prices within shelter. This is seen as bullish, as we see inflation closer to its target after adjusting for a change in measure.
Source: Innova Asset Management, Bloomberg
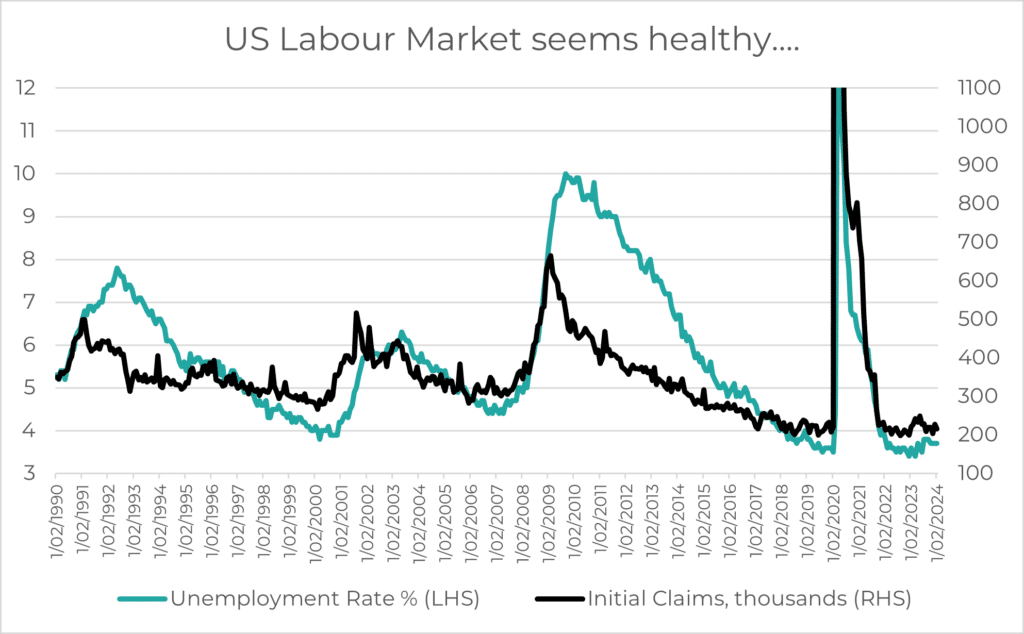
Whilst the unemployment rate is backward-looking, initial claims are generally forward-looking, as we get an indication of how many workforce participants have filed for financial assistance after losing their job – we get this data on a weekly basis! Both these indicators look quite healthy now – indicating that labour markets in the US have been fine.
Source: Innova Asset Management, Bloomberg
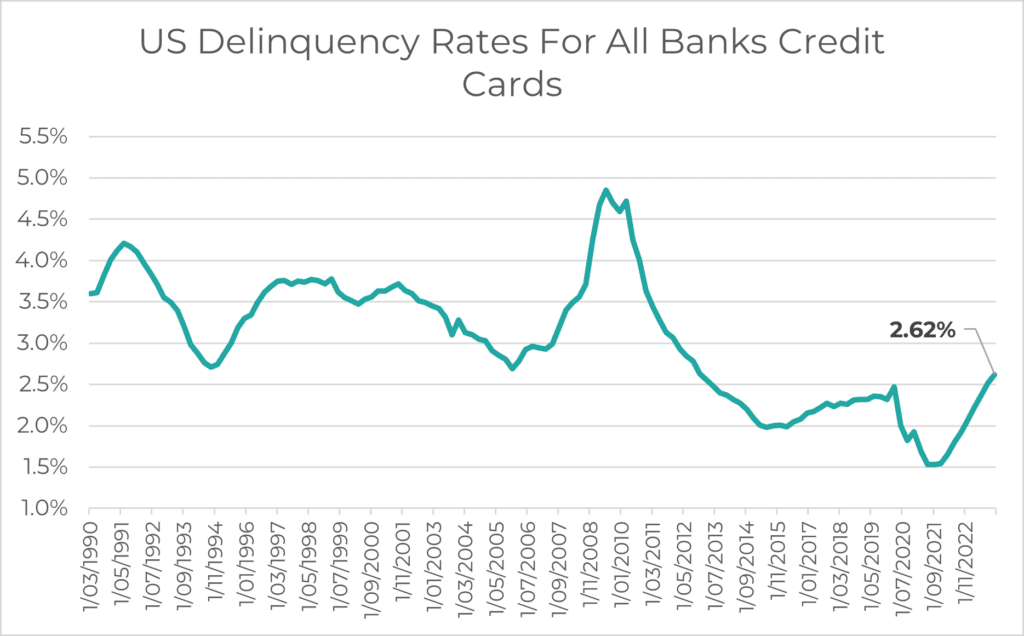
US delinquencies on all banks’ credit cards do not seem to yet be at very threatening levels. We’re currently around half the level we were at before the GFC. This indicator can be seen as forward-looking for the health of the consumer, giving an indication of stress on households and their disposable income.
Source: Innova Asset Management, Bloomberg
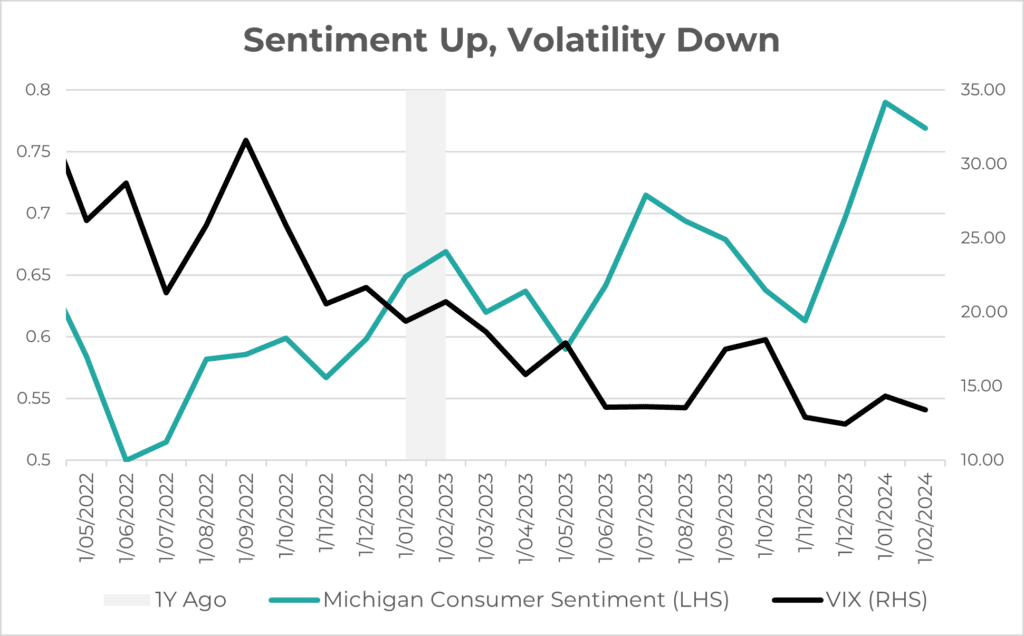
Sentiment is a lot higher than it was a year ago, which is a result of surprises to the upside for the economy in terms of the battle against inflation and the potential for rate cuts. Volatility has therefore come down massively for equities, though still showing signs of stress in bond markets. Sentiment can often reflect information from the past but be a good indicator for the forward spending patterns and investing behaviours of individuals.
Source: Innova Asset Management, Bloomberg
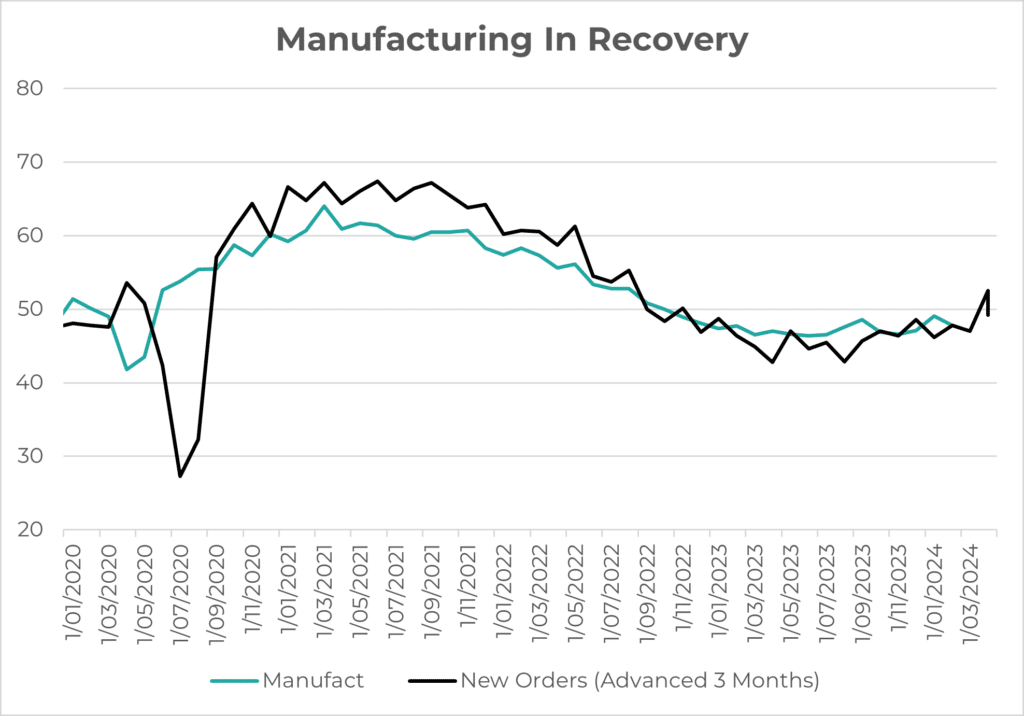
The ISM PMI Manufacturing Index is showing signs of improvement in recent months, though still in contractionary territory (below 50). This survey assesses the condition of the manufacturing sector by talking to over 300 companies. This indicator can be a good forward measure – giving us early signs of dampening/strengthening conditions in rate sensitive areas of the economy such as manufacturing and industrials.
Negative Picture
The bears have focused in on slightly more niche signals, which may be more “leading” in nature. The first one being the obvious inversion of the yield-curve, which has previously been a very strong predictor of recessions. During this negative picture section, I will try and use the same data but in slightly different ways…highlighting that you can paint the picture you’d like!
Source: Innova Asset Management, Bloomberg
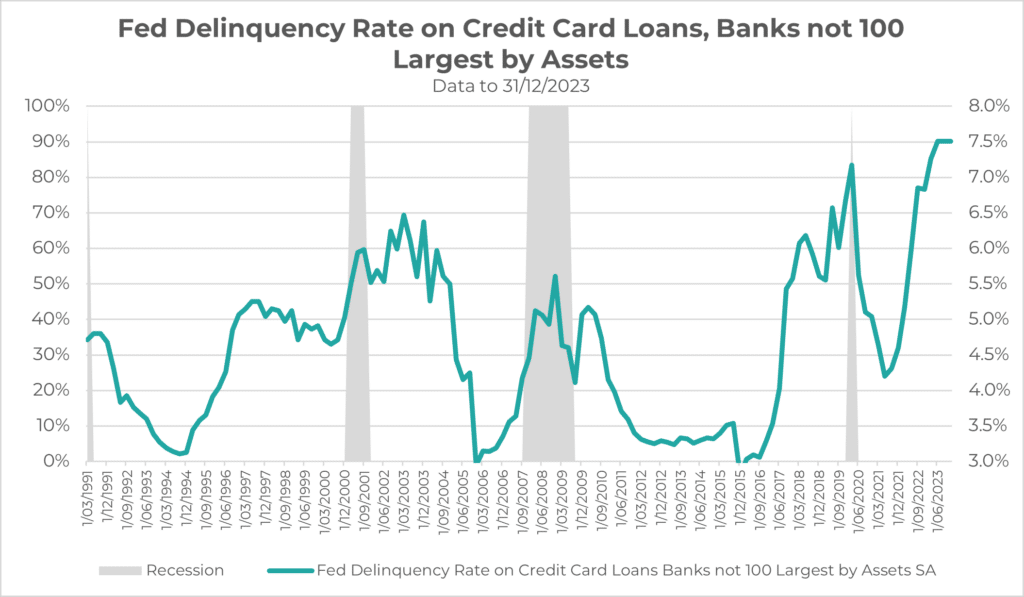
Here we see again, delinquency data, but for a slightly more cyclical component of the economy (excluding the largest 100 banks) … Here we see a very bearish signal, which is also forward-looking, but just picks out a different part of the same data as before (i.e. credit card delinquencies – however these are excluding the largest 100 banks which paints a very different picture to the previous chart).
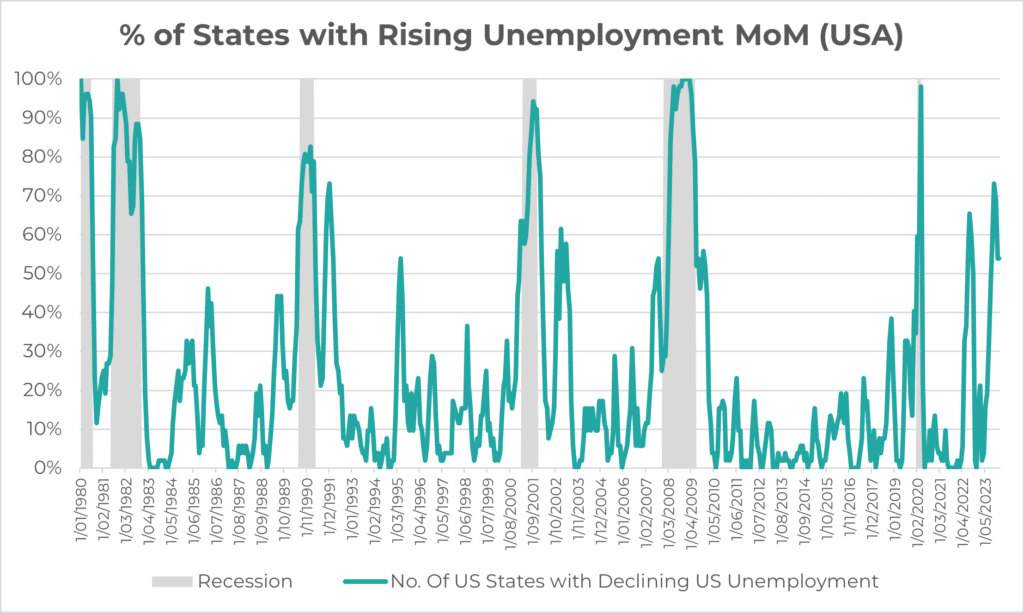
Source: Innova Asset Management, Bloomberg
In the positive picture we said the labour markets were strong, right? Wrong… according to the data above…Whilst there is strength in the headline numbers, the weakness across many states has previously been a bad sign for the economy – which in this chart looks like we’re in trouble, but are we?
Let’s stick with the labour markets for a second:
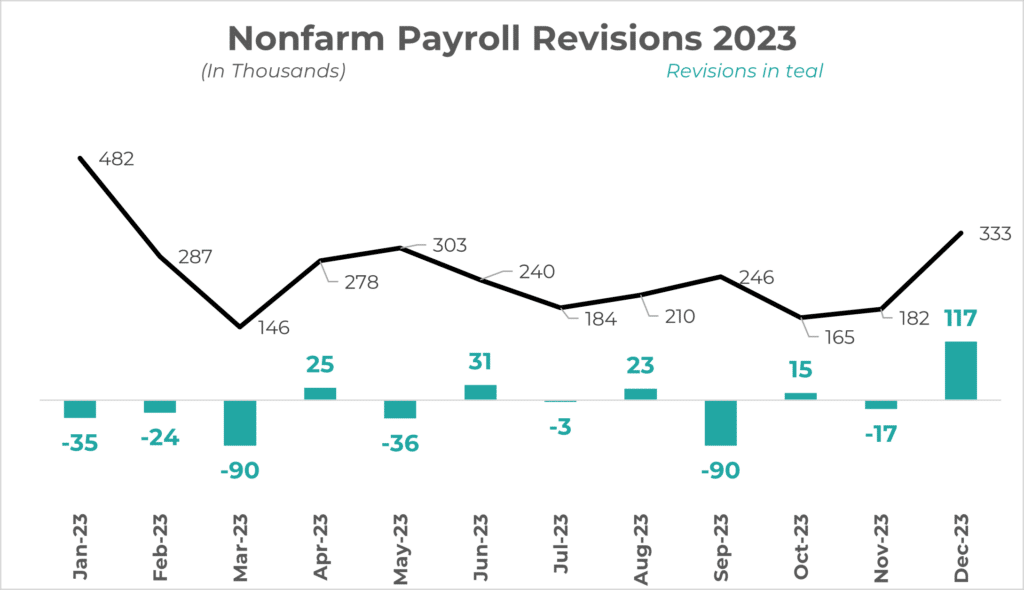
Source: Innova Asset Management, Bloomberg
Whilst there’s some positivity in the absolute value of the readings, there are several negative revisions throughout 2023 for job creations – but are we looking too much into it? Generally, the actual data is backward looking, but the revisions can be forward-looking.
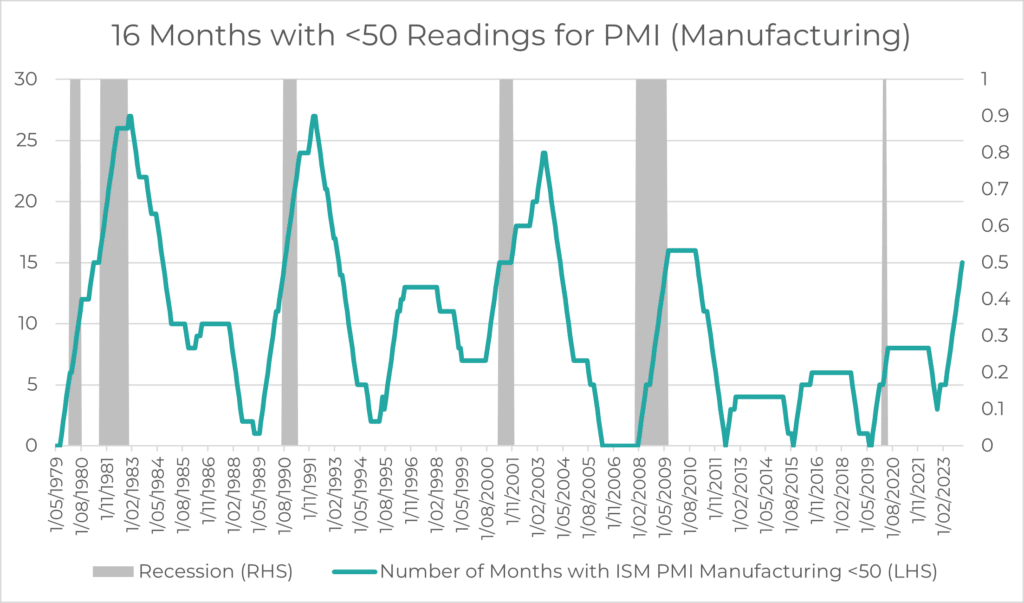
Source: Innova Asset Management, Bloomberg
And here is the negative side of the manufacturing surveys that seemed positive before, but now looks negative. Generally, when the survey stays below 50 for long enough, we see a significant economic slowdown, except for 1996 when we saw a rare soft landing.
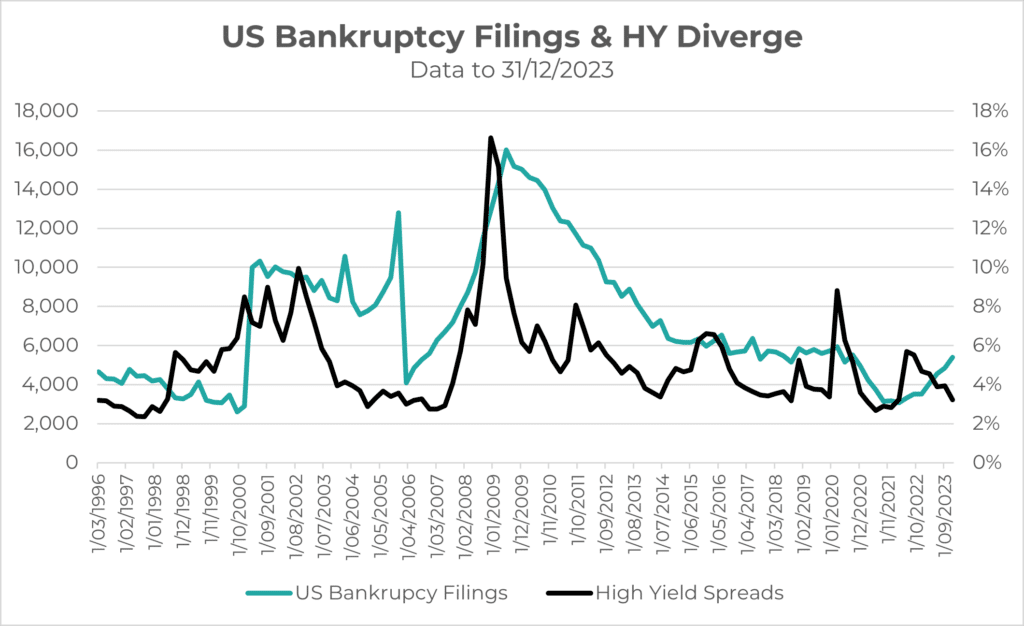
Source: Innova Asset Management, Bloomberg
Weaker companies are going bankrupt, and spreads don’t seem to care (I.e. the debt is not being repriced on the junkiest end of the bond market). Normally you would see spreads expand (prices fall) in High Yield bonds as investors demand a greater premium for the risk being taken on. This seems out of line considering how closely they behaved in previous times of stress and increased bankruptcy filings.
Source: Innova Asset Management, Bloomberg
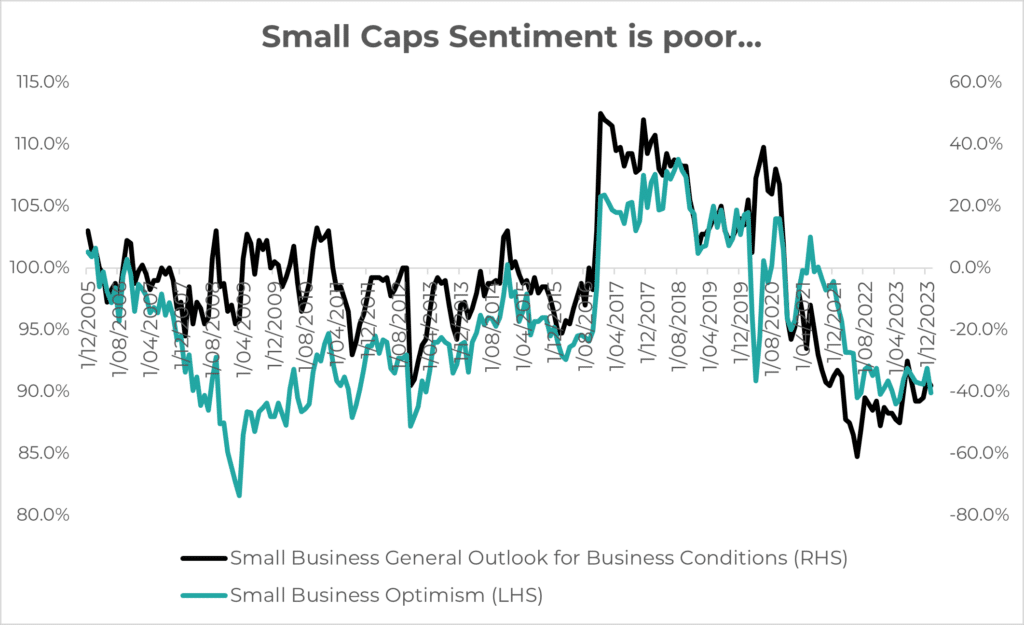
Previously we saw that consumer sentiment was getting stronger, but small business owners seem to be in a shambles. It’s clear the more interest rate sensitive companies (small companies) are being pressed by tighter financial conditions.
Source: Innova Asset Management, Bloomberg
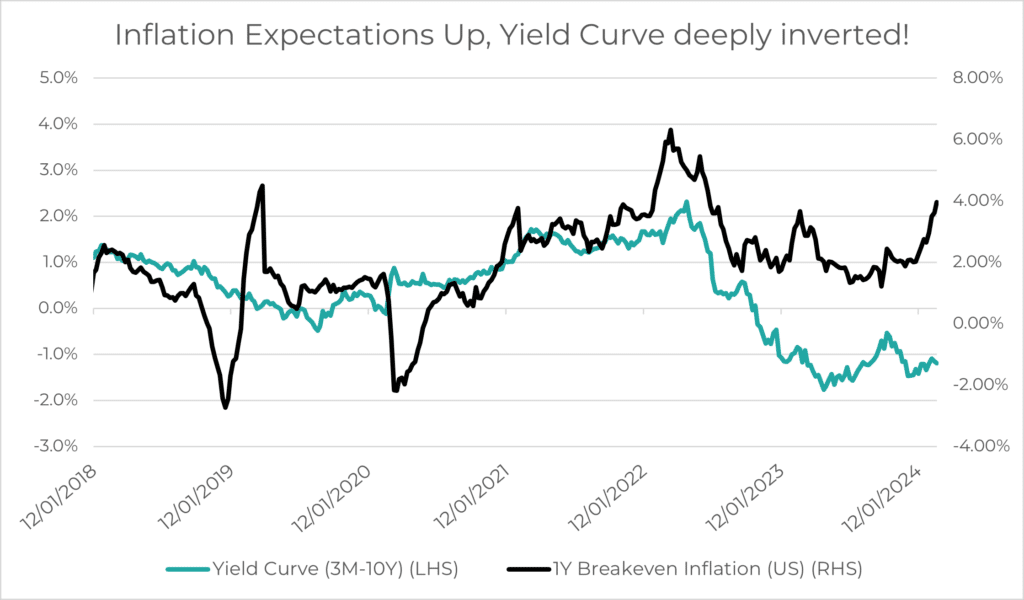
We’ve seen lots of commentary around the yield curve being a good predictor of recessions and leading generally by 16-24 months, but that hasn’t happened yet. To add some problems in January, we’ve seen a slight uptick in leading inflation indicators and an upside surprise in core PCE MoM. With 1Y breakeven rates back to ~3.95%, a risk of an inflation bump again, following the strong GDP numbers in Q4 is a concern that has arisen again. Both these indicators are naturally forward-looking because they are market priced.
Final Remarks
As you can see it’s very easy to pick and choose the story you want. This can be quite dangerous for a fund manager, as you can feed your own biases with the data that you are looking for and ignore the data that opposes your views (confirmation bias). A key exercise for those aiming to form a view on the economy is to count how many positive signals you have seen, how many negatives and which side has more forward-looking signals as opposed to backward-looking indicators.
In early 2023, many market watchers and economic gurus rushed to the conclusion that a recession was imminent based on indicators that had previously worked such as the yield-curve inversion. However, not every economic cycle is the same, and therefore investors must really dig into all corners of data and assess in the most objective way possible before forming a narrative that isn’t biased to their current positioning or asset-class that they manage.


