Reading the title, you’re probably sighing, because let’s be honest every man and their dog has just about written about inflation at this point, and you’re probably sick of it. Before 2021, it was a very foreign idea to have “structural”, high inflation – or even inflation volatility / concerns at all, and now it feels like a gungy rash that we’re all struggling to get rid of (well, mainly central banks). The recent spikes however have really divided the opinions of many very intelligent people, are these higher prices here to stay or was this phenomenon one we can wear off in a couple of years? I’m not necessarily going to dive into the transitory / structural debate in this piece, but rather present what prices have looked like historically with different levels of inflation.
Below we use data from February 1973 to October 2023 to understand how traditional asset classes, as well as a “Balanced Portfolio” has performed during different levels of inflation:

Source: Bloomberg, Innova Asset Management
Note: “Balanced Portfolio” is equal to 10% RBA Cash, 12.5% Ausbond Composite, 12.5% Global Aggregate (US Bonds before 1990), 10%, 10% FTSE REITs, 27.50% S&P/ASX 200, 13.75% MSCI World ex AU, 13.75% MSCI World ex AU (Hedged). All returns are in local terms.
Looking at realized US CPI YoY as the inflation proxy, we can see that balanced portfolios struggle when inflation is high, which is expected. Gold seems to be the only asset class that is resistant during the higher inflationary periods – though has been somewhat inconsistent in a historical context. When prices rise in economies – one may find it intuitive to store wealth in gold or other commodities to ensure they don’t erode their purchasing power from their fiat currency. Overall, gold can be a strong protector in portfolios, and an “insurance” asset in any time of financial turbulences.
Structural Inflation?
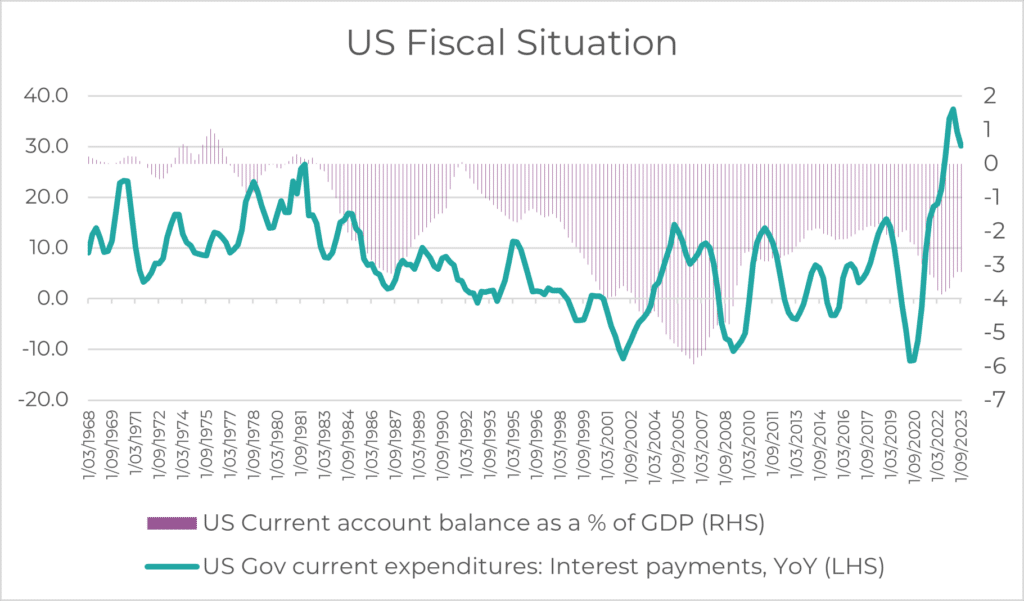
Many have speculated recently regarding where they actually see inflation ending up in the long-term. The recent inflation spikes were initially driven by supply shocks, primarily to the more volatile components, which we saw settle down, and certainly the goods component settled. However, we’ve seen the stickier services side roll over much slower, which makes us naturally ask the question of where the longer-term level will be, alongside many “structural” factors that people have argued such as the energy transition (green), onshoring/friend shoring manufacturing (supply chain diversification), geopolitical tensions (weapons and energy costs) as well as the fiscal picture in the US.
The injection of 3.1T~ USD of liquidity diluted and worsened this topic, as it all coincided with each other, but were we already heading towards a higher secular inflationary environment? We now see an enormous issuance of US treasuries which in recent times has pushed yields up (increasing risk and supply), and therefore has pushed against restrictive monetary policy which is being used to try and stop the inflation in the first place. The primary reason for the over issuance of US treasuries, even at such high yields, is because the US central bank is no longer a buyer of US treasuries, and hence the funding of US fiscal deficits must be sourced from elsewhere.

Source: Bloomberg, Innova Asset Management
Pushing back on these, there are also arguments to be made about the increased productivity that can be brought about by developments in AI – however we have no real tangible evidence of the effects and in what sort of timeframe we can expect this revolution.
Forward Looking and the Now
In very recent times, we’ve seen an increase in inflation volatility again, as well as forward market pricing for inflation. The 5year-5year inflation measure, which tells us what the market believes the 5 year inflation will be in 5 years’ time is close to 2015 highs, which certainly is not in that 2% target that the Fed is trying to reach.

Source: Bloomberg, Innova Asset Management
Given all of this, where do we sit now in terms of critical measures such as yields, valuations and real GDP, and depending on where you see inflation in the medium term, what should those values look like?
Levels using US CPI YoY:

Something that markets clearly don’t like is inflation volatility, so how historically have key levels looked when inflation volatility was higher / lower…

Source: Bloomberg, Innova Asset Management
Levels using Volatility of US CPI YoY:

The current levels of these key indicators may suggest that we have inflated valuations, stronger than expected growth and yields climbing. If we see inflation not enter that ~2% range in the coming medium term, we may see a serious repricing of risk assets, a heavy drop in growth and a prolonged tightness in financial conditions – which would weight not only on interest rate sensitive sectors of the economy like it already has. Of course, this all depends on the actions of the Fed and their rate cutting decisions – which if the US economic growth scenario continues its strength somewhat and doesn’t erode to “crisis” levels, we don’t see why they would cut.


