
Why spreading your risk has gotten harder
For a long time, the standard way to build a balanced portfolio was to hold a mix of shares and bonds – typically around 60/70% shares and 40/30% bonds. The idea was simple: shares grow your wealth, and bonds act like a cushion, tending to hold up (or even rise) when shares fall. When one zigs, the other zags, and the ride is smoother overall.
That relationship has been far less reliable since the volatile inflation environment that followed COVID. When inflation and interest rates are the main driver of markets, shares and bonds can fall together – which defeats the purpose of holding both.
This is really just about not having all your eggs moving in the same basket. If two parts of a portfolio tend to rise and fall together, holding both doesn’t reduce your overall risk much – you’re effectively making one bet twice. The less two investments move in step with each other (ideally, one rising when the other falls), the smoother your overall portfolio ride, for the same expected return.
This is a big part of why the investment industry has spent the past few years pushing beyond traditional bonds – into alternatives, commodities, hedge fund–style strategies, and private assets – on the theory that, in a world of heavier government spending and higher debt levels, bonds can no longer be relied on to offset share market falls. It’s a reasonable theory. But has it actually played out in Innova’s own portfolios, or has it just been industry talk? That’s what this note tests.
What we tested
We looked at the three core building blocks of Innova’s Risk-Defined Flagship Wealth Creation portfolio (our “Balanced”-style option) since the market conditions of the post-COVID period began:
• Global Shares
• Alternatives
• Fixed Income (bonds)
For Fixed Income, we compared how closely the Innova sleeve has moved with global shares, against how closely a standard bond index (the AusBond Composite) has moved with global shares – then checked whether Innova’s active approach actually smoothed the overall ride more than the index would have.
For Alternatives, there’s no obvious like-for-like index, so we compared it against a simple cash holding instead. All the alternatives strategies used here can be bought and sold daily – no illiquid private assets are included.
Fixed income: similar correlation, better outcome
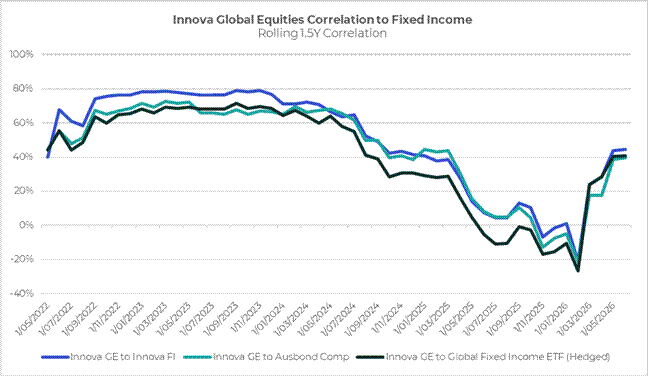
Innova Fixed Income has moved in step with global shares in almost exactly the same way as the AusBond Composite has, throughout the period. In other words, active management hasn’t meaningfully changed how this sleeve behaves relative to shares.
How closely Innova Fixed Income and the AusBond Composite have each tracked global shares, over rolling 18-month periods:
Source: Bloomberg, Morningstar, calculations by Innova Asset Management
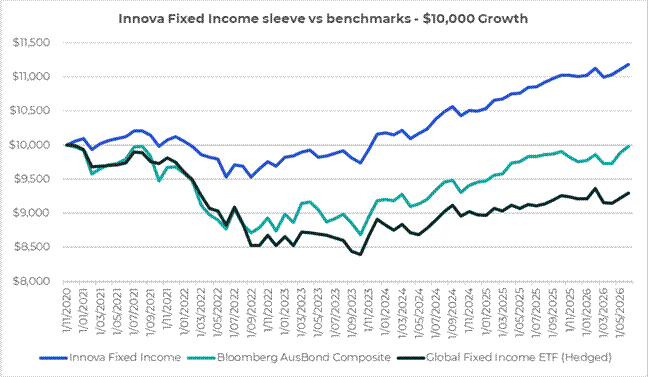
What has differed is the outcome. Innova Fixed Income has grown steadily with a much smoother ride, while the AusBond Composite has been roughly flat over the same period and suffered far larger falls along the way.
Growth of $10,000 invested in each: Innova Fixed Income, the AusBond Composite, and a global bond ETF (currency-hedged):
Source: Bloomberg, Morningstar, calculations by Innova Asset Management
Alternatives: a genuine offset to share market risk
Alternatives tell a different story. Across the period, Innova’s Alternatives sleeve has genuinely tended to move in the opposite direction to global shares, while a simple cash holding has tended to move mildly in the same direction as shares. This is the real-world version of the diversification benefit described above: cash is a fairly weak diversifier here, while Alternatives has behaved like a genuine offset to share market risk.
How closely Innova Alternatives and cash have each tracked global shares, over rolling 18-month periods:

Source: Bloomberg, Morningstar, calculations by Innova Asset Management
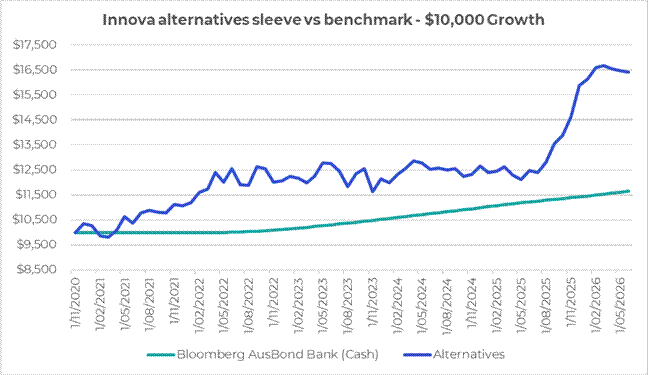
Importantly, this hasn’t come at the cost of returns – Alternatives have also comfortably outgrown cash over the same period. The sleeve has diversified the portfolio and grown investors’ wealth at the same time.
Growth of $10,000 invested in Innova Alternatives versus cash:
Source: Bloomberg, Morningstar, calculations by Innova Asset Management
The numbers side by side
| Sleeve | Yearly return | Yearly ups & downs* | Correlation to global shares** |
| Innova Fixed Income | 2.0% | 3.2% | 0.51 |
| AusBond Composite | -0.0% | 5.4% | 0.48 |
| Global Fixed Income ETF (Hedged) | -1.3% | 4.8% | 0.46 |
| Innova Alternatives | 9.13% | 10.8% | -0.32 |
| Cash (benchmark) | 2.7% | 0.5% | 0.15 |
* A measure of how much an investment’s value tends to move up and down – a lower number means a smoother ride.
** How closely an investment has moved in the same direction as global shares. A negative number means it has tended to move the opposite way.
What this means for a whole portfolio
These differences only matter if they actually make a whole portfolio smoother to hold. To test that fairly, we adjusted the cash holding so it had the same degree of ups and downs as Alternatives, then compared two versions of a 60% shares / 40% “sleeve” portfolio – one using Alternatives, one using this adjusted cash – using monthly returns over the period.
Even after removing any difference in how bumpy each holding is on its own, the portfolio using Alternatives was noticeably smoother overall than the one using cash. Because both were adjusted to a similar level of ups and downs, that gap comes down to one thing: Alternatives’ tendency to move opposite to shares – a benefit cash simply can’t replicate at the same risk level.
The fixed income comparison works differently. A 60/40 portfolio using Innova Fixed Income is also smoother than one using the benchmark bond index – but not because of a different relationship to shares, since the two move with shares in a very similar way. Instead, the improvement comes from Innova Fixed Income being less volatile in its own right, a result of active decisions about how long-dated and how high-quality the bond holdings are.
The bottom line
By recognising that the old relationship between shares and bonds has become less dependable, and responding with active decisions rather than sticking to static asset-class labels, Innova has achieved two different things: a genuine reduction in correlation to global shares where it matters most (Alternatives), and a smoother overall ride through active bond management (Fixed Income) – even where that sleeve’s relationship to shares hasn’t changed.
These are two different diversification stories: Alternatives earns its place through a genuine offsetting relationship with shares; Fixed Income earns its place through careful, active risk management. Both make the portfolio smoother to hold, but understanding why each one works matters for how much weight each should carry going forward.
We haven’t covered how diversification and active management play out within the share portfolio itself – that’s a question for another note.
What this really comes down to is not assuming a diversification strategy works just because the textbook says it should – but continually testing it against what’s actually happened in investors’ portfolios. That ongoing scrutiny is at the heart of how Innova manages money on our clients’ behalf.
Data note: All “Innova” sleeve returns are calculated internally via Morningstar and Bloomberg fund data. Index returns are sourced from Morningstar. Historical weights are drawn from the Innova HUB model for Risk-Defined Flagship Wealth Creation. The simulated portfolio figures use realised sleeve-level monthly returns over the sample period and are for internal analytical purposes only – they do not represent an actual portfolio and are not investment advice.
The information contained in this document is commentary only and cannot be construed as personal advice. The views expressed here are subject to change at any time. To the extent permitted by law no liability for loss or damage is accepted for reliance on or use of the information contained in this document.


