1. Why Returns Aren’t the Whole Story
If you’ve recently opened your end of financial year super statement, chances are you’re smiling. Many super funds delivered double-digit returns over the past year – not bad considering the turmoil earlier in the year.
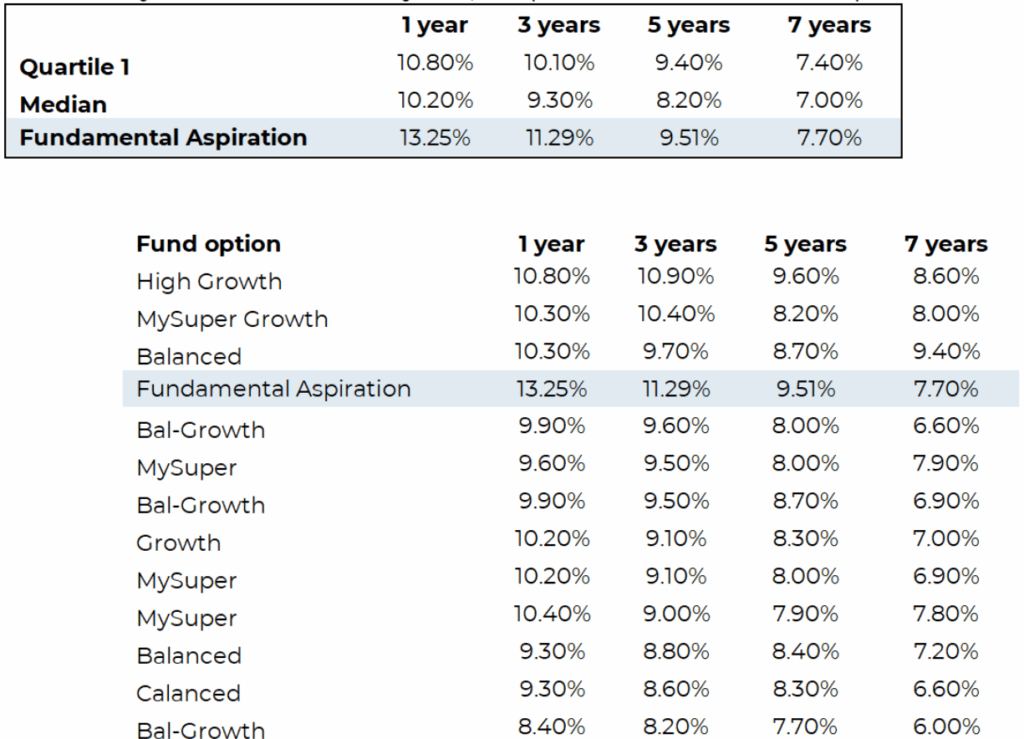
But here’s the catch: while those numbers look great, they don’t always mean what you think. When compared to fully liquid, transparent portfolios – ones where every asset can be priced and sold any day – those big super fund returns for their “medium risk” default offers don’t look quite as good.
And when you zoom out to five years, the picture looks even less impressive.

Source: Innova Asset Management with data from the public website of various Superannuation funds, confirmed against Rainmaker data
2. The Hidden Driver Behind the Numbers
One reason for the strong results is simple: some funds take on more risk than others. When markets are rising, the more risk you take – all else being equal – the better the returns you should get.
A so-called “balanced” fund might have just 50% in traditional “growth assets” like shares. Another “balanced” fund could quietly run at 80–90% growth. Same label, very different risk.
That difference explains a lot of the performance gaps – but it’s not the full story.
3. The Unicorn Assets
Here’s where things get tricky. Many funds call some exposures to unlisted property, infrastructure, or private assets “defensive.” On paper, that makes their portfolios look safer. But these aren’t magical unicorns that defy economic reality. They are economically sensitive:
● Shopping centres don’t do better in a recession.
● Ports don’t get busier when trade slows.
● Airlines don’t fly more passengers when times are tough.
● You’re unlikely to see increased toll use when consumers are tightening their belts.
● Tenants don’t happily pay higher rents when their own incomes are under pressure.
The cash flows generated by these assets rise and fall with the economy – just like most companies (which is what a ‘share’ is – a small piece of ownership in a company). The only reason they look calmer is because they’re not priced every day. Infrequent pricing hides the risk but doesn’t remove it. However, it does introduce “illiquidity risk” which is often not a problem… Except when it is. There is a tendency for liquidity to be available to sell assets when things are going well – because everyone is buying (driving up the price). But when things go bad, there’s no one to sell to – and that can be VERY problematic (just google “MTAA GFC”).
4. The Allocation Game
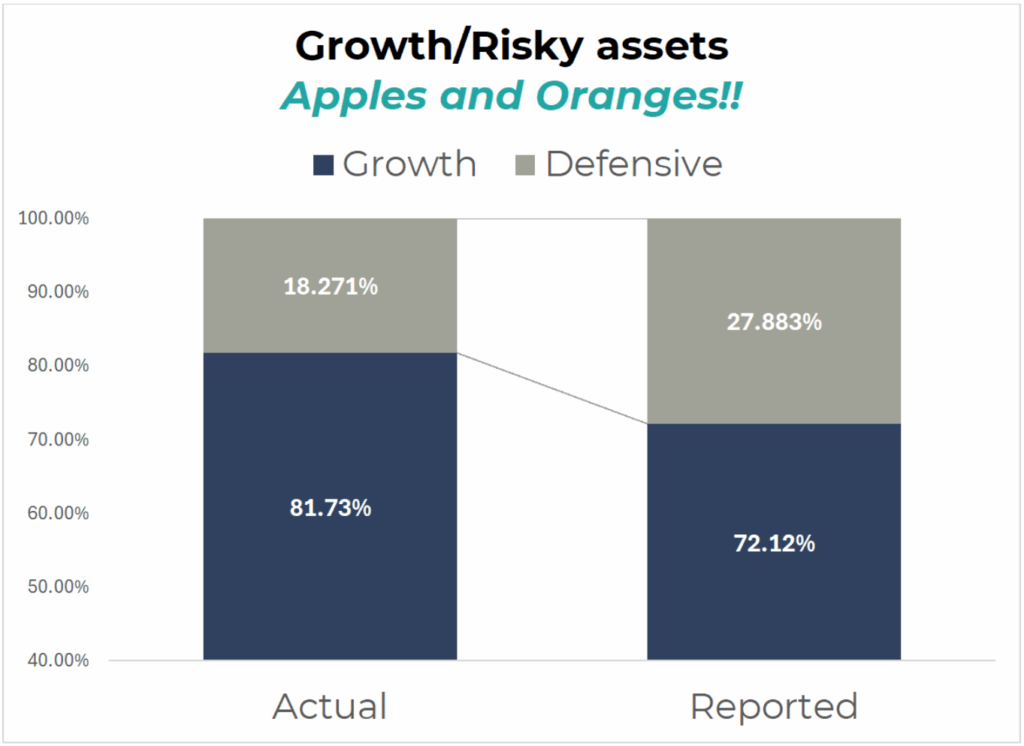
Here’s what we’ve seen when digging into some big Super fund MySuper/default disclosures (examples renamed for this article):
● Example Fund 1 says it holds ~73% growth and ~27% defensive. Reality: AT LEAST 80% growth.
● Example Fund 2 is a pool in a MySuper lifecycle offer. It claims ~70% growth, but adds up closer to 82.75%.
● Example Fund 3 says ~76% growth, actual ~83%.
● Example Fund 4 says ~76% growth, actual ~91%.
When you strip away the spin, true defensive assets – ones that don’t lose value or preferably MAKE MONEY in a downturn (cash and some fixed interest, and some strategies) – are often closer to 15–20% of the portfolio.

Source: Innova Asset Management with data from the public website of various Superannuation funds
5. Why It Matters for Everyday Investors
Think about this: if your job or business is tied to the economy, your income already falls when conditions get tough. If your super is also loaded with “defensive” assets that actually depend on the economy, you could get hit twice:
● Your income drops.
● Your super drops.
That’s not real protection. That’s doubling up on risk without knowing it.
6. The Takeaway
Performance tables make it look like some funds are clear winners. But the reality is that many achieve those results by quietly taking more risk and disguising it as safety.
A classic example of comparing “apples & oranges”
It works in good times. But when the economy turns, those “unicorn” assets won’t protect you.
True defensive assets – cash and high-quality bonds, along with some alternative strategies – are the ones that defend your portfolio. Everything else is growth, whether it’s listed on the share market or locked away in private deals.


